CYBERSECURITY DETECTION & MONITORING LAB:- Part Seven
SPLUNK CONFIGURATION
Introduction
Welcome back to the blog series, ‘Cybersecurity Detection and Monitoring Lab’. Find the link to part six of the lab where we set up our victim network with vulnerabilities that we can exploit.
In this episode, we set up Splunk, a Security Information and Event Management (SIEM) service that we will use to primarily receive logs from the Domain Environment via a Universal Forwarder. Splunk is currently one of the most popular SIEMs used in enterprise environments globally. Splunk aggregates logs and data (of security interest) from various devices in a network. It then correlates all that information for searching, parsing, and indexing, making it easy for security professionals to keep a close eye on the infrastructure and investigate suspicious activity.
Below is the network topology diagram to give you a clear picture of our desired result.

Splunk Installation and Configuration
The Splunk instance will be hosted in the Analyst VM. Let’s download and install the instance by following the steps:
- Log in to your Security Analyst VM. Go to the following URL
https://www.splunk.com/en_us/download/splunk-enterprise.html
- While on the page, click on ‘Get Started’. This will direct you to either Log In if you have an account or Create an Account. Proceed as necessary.
- Go to the Linux section and click on ‘Download Now’ on the .deb version.

- After the installation is complete, open the terminal and navigate to the Downloads folder.

- Run the following command sudo apt install curl to install the curl command. This Linux command is used to fetch data from URLs, handle HTTP requests, and download and upload files on the web. In our use case, it is a dependency for Splunk. Enter your password when prompted.

- Run the following command to install Splunk: sudo dpkg -i splunk-9.2.1–78803f08aabb-linux-2.6-amd64.deb. Note that the name of the file may defer if you download a newer version of Splunk. Use the filename that you downloaded in the command above.

- After the installation is complete, run the command ‘sudo /opt/splunk/bin/splunk start –accept-license –answer-yes.
- Provide credentials i.e. username and password, that will be used to log into Splunk when prompted.

- Once the setup is complete, we will see Splunk running on http://127.0.0.1:8000 which can be accessed at http://analyst:8000.

- If you’d like Splunk to run automatically on system boot, run the following command: sudo /opt/splunk/bin/splunk enable boot-start. Alternatively, if you’d like to start the Splunk instance, run the command: sudo /opt/splunk/bin/splunk start.
Splunk and Splunk Universal Forwarder Configuration.
- Open Splunk by going to http://analyst:8000.

- You should log in to the following Admin Dashboard.

The Splunk Universal Forwarder is a mechanism that logs the activities on endpoints. It is used to send logs from different sources to the Splunk instance. We will download and configure it so that it sends logs from our Domain Controller to our Splunk instance.
First thing we have to do is set up the ability for logs to be received by our Splunk instance. To do this, proceed with the following steps:
- Go to ‘Settings’. Then go to ‘Forwarding and Receiving’.

- Click on ‘Add New’ in the Receive data section.

- Enter 9997 as the port to listen for incoming data. This is the default port that the Universal Forwarder listens on. Click on ‘Save’.


Now, we create an Index. Splunk indexes are repositories where our logs are stored that thereafter allow us to use Search Heads to search for data from these indexes.
- Go to ‘settings’ and click on ‘Indexes’.

- Click on ‘New Index’.
- Type the Index Name ‘wineventlog’ and click on ‘Save’.

- The index should appear as below.

Next, we need to download and install the Universal Forwarder in the Windows Domain Controller so that we can ingest the log data that is generated by our domain environment.
- Login to the Domain Controller and proceed to the following link to download the Universal Forwarder https://www.splunk.com/en_us/download/universal-forwarder.html
- Login to your Splunk account to complete the download. Click on the ‘Download Now’ button.
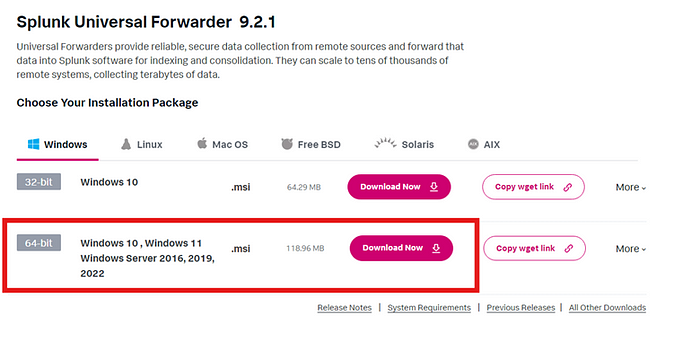
- Click on ‘Access program’ to begin the download.
- After the download is complete, click on it i.e. the ‘.msi’ file, to begin the installation.

- Check the box to accept the license agreement. Click on ‘Next’.

- Enter a Username and Password.

- For the IP address, we need the IP address of the Security analyst VM. Open the Analyst VM terminal and type the command ‘ifconfig’ to get the IP address.

- Use the enp0s3 address and enter the default port as directed.

- Enter the Analyst VM IP again and the default port as directed.

- Click on ‘Install’.

- Click on ‘Finish’.

Now that we have both Splunk and the Universal Forwarder configured, we need to link both pieces together so that Splunk can collect data i.e. The Data Ingestion Configuration.
- Go to Splunk, ‘Settings’, and click on ‘Add Data’.

- Click on ‘Forward’.

- The Windows DC should automatically appear under Available Hosts. Click on ‘Add all’ and input the name ‘Domain Controller’ in the ‘New Source Class Name’ field to provide a name for our source. Click ‘Next’ to continue.

- Select ‘Local Event Logs’. Select ‘Add all’. Click on ‘Next’.

- Click on the ‘Default’ dropdown and select the previously created ‘windowseventlog’. Then click on ‘Review’.


- Confirm all the options are correct and click on ‘Submit’.

- At this point, the lab is set up. You can click on ‘Start Searching’.

- The following page will load, showing the queried data. You can also get to this page by going to ‘Apps’, then ‘Search & Reporting’. Be sure to match the index i.e. index=’windowseventlog’ as highlighted below.

CONCLUSION & RECOMMENDATIONS
Finally, our home lab is up and running. The immediate next steps should now focus on looking at each of the technologies used in detail.
· We’ll start with pfSense specifically looking to understand firewall rules and how they affect the network.
· Then proceed to tighten our knowledge of Active Directory, how to set policy rules, and how they can make or break our network security.
· Then proceed to do a walkthrough of Security Onion, exploring the inner workings of the Security Information and Event Management (SIEM) system and gaining a better understanding of SIEM thereafter SOC operations.
· Finally, we’ll review Splunk, and explore the services and use cases it can and is applied to in enterprise environments.
The most important thing is to have fun while learning. The lab is set up in such a way that we can engineer attacks, see their effects, collect the logs, and mitigate against them. I can safely say, that the Cybersecurity world is both your and my oyster.
Thanks alot for following the walkthrough and to all the creators who have published the free resources I have used in this lab. Good luck to all of us! Happy Learning!
RESOURCES.
Below are the resources I used throughout the lab.
- Gained insights on the general lab architecture and a brief security onion introduction watch, Cyberwox’s YouTube series: https://www.youtube.com/watch?v=0BVtSRhjViQ&list=PLDqMNdDvMsRkmtiKcZwbhOz7MeLQE0r3G&index=1
- To learn how to configure VirtualBox for the lab environment, read the 0xBEN’s blog: https://benheater.com/building-a-security-lab-in-virtualbox/
- For another resource for the lab architecture, see @TheCyberChef’s blog series: Monitoring and Detection Lab Part One — Five: https://medium.com/@cyberchef1/monitoring-and-detection-lab-part-one-cd1c6df25228
- For additional information on Splunk and its setup, see David Varghese’s blog, Building a Virtual Security Home Lab: Part 10 — Splunk Setup & Configuration https://blog.davidvarghese.dev/posts/building-home-lab-part-10/
